
When working with statistics, OpenOffice.org Calc is handy to calculate a confidence interval. The purpose is to estimate the mean (average) of a population from a sample of the population.
As a typical example, CNN reported, "63 percent of respondents say [New Orleans] should rebuild" after Hurricane Katrina (September 2005). A small note at the bottom of the article indicates the confidence level: "For poll results based on the total sample, one can say with 95 percent confidence that the margin of error is plus or minus 4 percentage points." CNN could not poll everyone, so they polled a sample. Then, based on the data, they were able to estimate how well the sample (those polled in New Orleans) represents the population (everyone in New Orleans).
Checklist
Your data must be a random sample.
Getting data
For our tutorial, let's use the NIST data set Heat Flow Meter 1. You may substitute your own data with the proper modifications to the formulas (more on that later).
- Open a blank OpenOffice.org Calc document.
- In cell
A1, type x to label the column. - Visit NIST's Heat Flow Meter data set page.
- Copy the 195 observations to the clipboard.
- Return to the spreadsheet.
- In cell
A2, paste (using the toolbar or the keyboard shortcut Ctrl+V).
Calculating the confidence interval
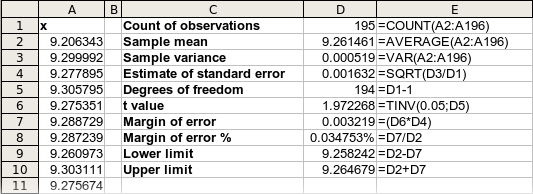
These formulas calculate the confidence interval and some dependent univariate statistics.
- In cell
C1, type Count of observations. - In cell
D1, type=COUNT(A2:A196). - In cell
C2, type Sample mean. - In cell
D2, type=AVERAGE(A2:A196). - In cell
C3, type Sample variance. - In cell
D3, type=VAR(A2:A196). - In cell
C4, type Estimate of standard error. - In cell
D4, type=SQRT(D3/D1). - In cell
C5, type Degrees of freedom. - In cell
D5, type=D1-1. - In cell
C6, type t value. -
In cell
D6, type=TINV(0.05;D5).This is the value of the inverse t-distribution. This calculation saves you a trip to your book's t-tables. Note that 0.05 (called alpha) = 100% - 95%.
- In cell
C7, type Margin of error. - In cell
D7, type=(D6*D4). - In cell
C8, type Margin of error %. - In cell
D8, type=D7/D2. - In cell
D8, press the Number Format: Percent button on the toolbar. - In cell
C9, type Lower limit. - In cell
D9, type=D2-D7. - In cell
C10, type Upper limit. - In cell
D10, type=D2+D7.
If you use a data set with more or less than 195 observations, you would need to adjust A196 in the above formulas to refer to the last cell.
Here are the final results. Column E shows the formulas in column D.
Exercises
- Format the appropriate cells to display 6 decimal places.
- Adjust the formulas to compute the 99% confidence intervals.
- Create a histogram chart for the data set.
- Add the observation 9.278823 to the data set. Adjust the formula so it is included.
- Why can you not interpret these results to mean, "We are 95% sure that 63% of New Orleans residents think they should rebuild after the hurricane"?
- Click on each formula in the D column. Then click the Insert > Function menu to bring up the Function Wizard. Then click on each input parameter, and review the help it provides.
- In OpenOffice.org, open the help by choosing the Help > OpenOffice.org Help menu. In the help index, lookup each of the functions used in column D.
- Add new formulas to calculate the median, maximum, minimum, range, and standard deviation.
- Add new formulas to calculate these descriptive statistics: kurtosis and skewness.
- Why can you not use the formula
=CONFIDENCE(0.05;STDEV(A2:A196);195)to calculate the confidence intervals in this example?
Microsoft Excel 2003
This procedure is the same in Excel 2003 except that Excel uses commas to delimit parameters in formulas where OpenOffice.org uses semicolons. No retraining is required.
Comments