OpenOffice.org 2.4 brings six improvements to data labels in charts.
Inserting data labels
To use any of these improvements, you will need data labels.
- Create a chart (usually in Calc).
- If you are not already in chart mode, double click the chart to enter chart mode. You should notice most buttons disappear from the toolbar.
- Click Insert > Data Labels from the menu.
After the labels are inserted, their options can be updated anytime from the same place (despite the use of the term Insert) or by right clicking on the data series in the chart, choosing Object Properties, and then clicking on the Data Labels tab.
Display both value and percentage
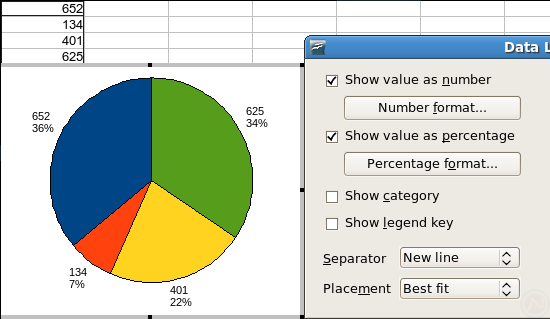
Can't decide between showing the value and showing the percentage? Show both. In the Data Labels dialog, check the boxes Show value as number and Show value as percentage.
Display each part of a data label in a separate line
As the amount of information in a data label grows, it may be necessary to move some onto a separate line. In the Data Labels dialog, change Separator to New line.

The Separator option is disabled unless you check two or more of the first three check boxes.
Choose number format
Before data labels always pulled their number formats from the source data. However, now you can choose any number format. In the Data Labels dialog, check the box Show value as number. Then, click the button Number format.
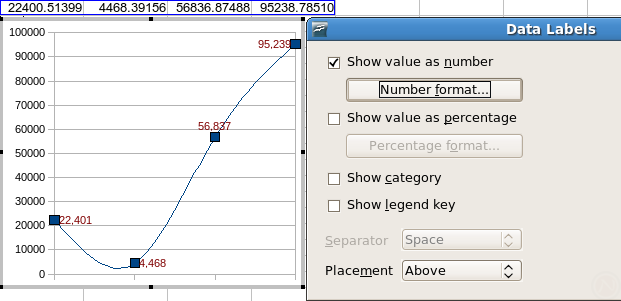
More flexible placement of labels on data points
There are many new options for placing data labels. To set the placement for either all the labels or individual labels, select either all the data labels or an individual data label (respectively). Then, in the Data Labels dialog, choose an option from Placement.
For column charts the options are above, below, center, outside, inside, near origin. For bar charts, the options are right, left, center, outside, inside, and near origin. For pie charts, the options are best fit, outside, inside, and center.
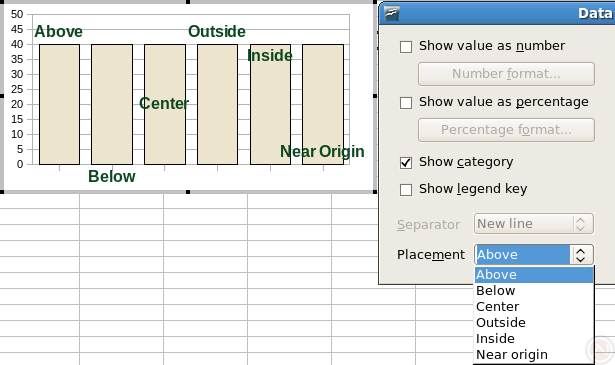
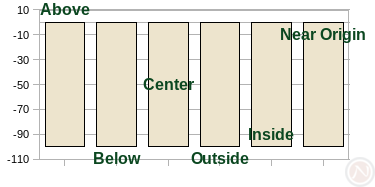
What's the difference between outside and above? When the values are negative, outside acts like below.
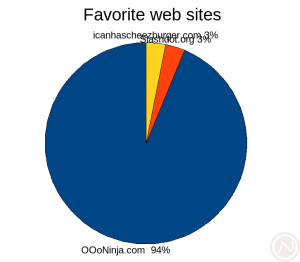
Improved automatic positions for labels on pie charts
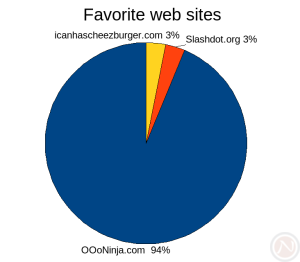
Labels on pie charts have the new option Best fit with an algorithm to prevent overlapping labels. Guess which pie chart uses Best fit and which uses Outside.
Remove individual labels
To remove the label of an individual data point, carefully follow this procedure:
- Click an area off the chart to unselect the chart.
- Double click the chart to enter chart mode. You should notice most buttons disappear from the toolbar.
- Single click on the data labels to select them all. Each label will show a green square.
- Wait two seconds.
- Single click the desired data label. It will be surrounded by eight green squares.
- Either press the Delete key or right click and choose Cut.

0 comments:
Post a Comment